Hi everyone, we are a group of students from Costa Rica trying to adapt OFN for our country(@jefgomez@dberrocal).
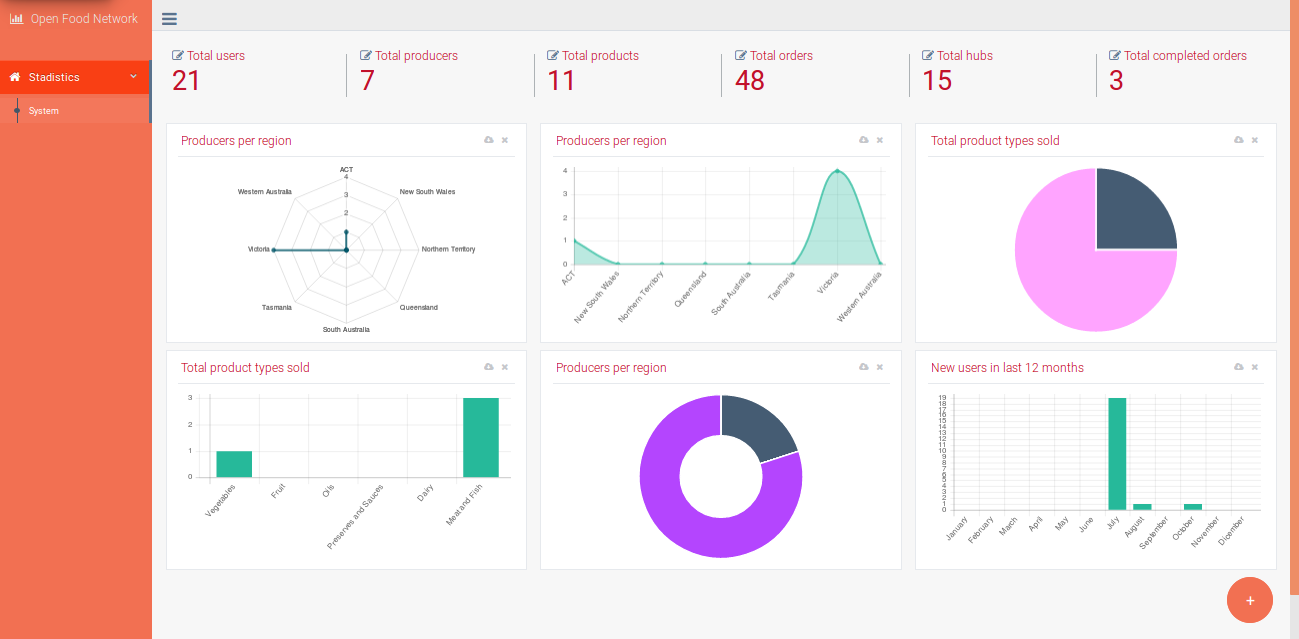
Days ago we talked with @MyriamBoure, and we showed her the UX Dashboard we are building, she told us about this community and we want to introduce what we got. It looks like this:
Another functionality is to download any chart as png file, we added this because we thought it could be useful if people need to add this kind of information to a document.
Our main objective of creating a UX Dashboard:
Useful and the system doesn’t include one yet.
Transform data into useful information, easy to understand.
Creating this helped us to understand how the platform works, so maybe in a future we can help developing some new tools or solving issues.
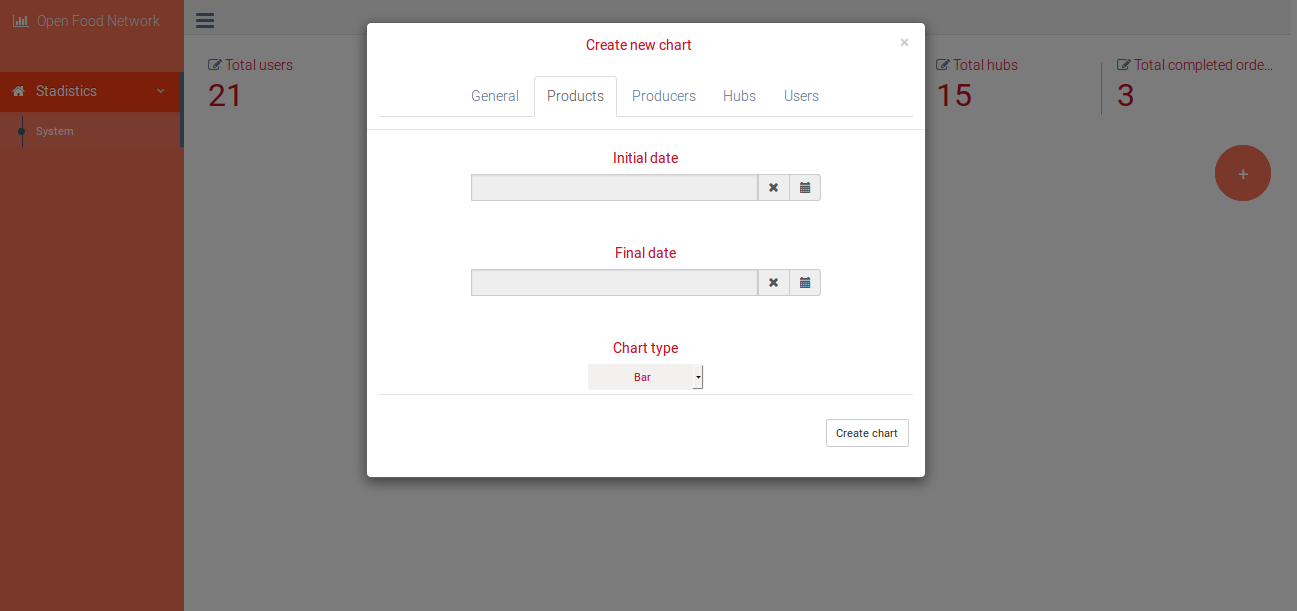
As we said, we are still working on it, so if you guys have any kind of suggestions or questions, feel free to tell us. Also we will like to know what you think about the filters.
Wahou, thank you @josuex09 for your contribution and for developing this feature!
When we discussed I found it was actually something needed to have an “instance manager dashboard”, with aggregated data about the instance, so that we can easily follow the key indicators and information of the instance, report to sponsors on impact and use of the platform for example, or for myself, I was super interested by having the list of new users who registered since one week for example, to be able to send a welcome message each week to new users.
I also thought as a suggestion that could be cool to be able to see at some point (maybe not so important now…) the cross-instance data, to be able to report globally on the OFN, the number of orders passed, the number of producers, etc. Not sure this is needed right now but that would be cool to measure our impact at some point, when there will be more users
I’ll have a closer look when I have some more time on Friday, but from quick glance the first thing I think to add is the amount being turned over by hubs / producers . . perhaps the top selling hubs/shops today/this week/this month etc? Might be a nice little touch to let them have a sales target (this would be elsewhere in system) and be able to see this here. Would enable the instance manager to see if someone is close to their target and do a bit of promotions push or something. Another thing might be a quick way to view who has specials, again so instance manager can do some extra promotions or drive traffic to own generally
just some quick ideas. I think this is great and that @sstead will certainly appreciate it!!
Wow! This is really cool, thanks so much for your effort on this!
To give you an idea, here are some of the statistics we have reported on: Shopping activity:
Total turnover through the instance (sum of order totals in all shops over a given time period). This is a good indicator of traffic and impact.
# of customers who checked out in a month (number of customer orders, minus duplicates) - Is a good indication of reach. Could do number of new customers/month as well.
# of orders
Average spend/order
Profiles- These stats show the pipeline of new users who are coming to the site.
Total number of visible enterprise profiles (broken down by producer/hub)
Total number of visible producer shops (would be good to break down into active/not active… have they had an open order cycle in the last month?)
Total number of visible hub shops (would be good to break down into active/not active… have they had an open order cycle in the last month?)
The above could be illustrated as ‘new in the last 30 days’ or a running tally or graph over time.
Subscriber stats - this indicates how much money the instance is raising from its fees
Number of enterprises who qualify for the instance business model fees (subscribers)
Average fee/subscriber
Total instance fee revenue/month or running tally of year to date.
For customer service purposes:
New enterprises who have signed up and made a profile (as Myriam said, so we can contact them and say welcome). It’s good to know a) name of enterprise b) email of the owner c) where they are located d) are they a producer or hub e) did they create a profile, or a shopfront f) are they visible or not g) What’s their description h) have they uploaded photos?
When did an enterprise user last login?
Who has opened an order cycle recently? Allows us to promote this on social media.
Enterprises listed by ‘last order cycle close date’ - we can contact people who haven’t had an order cycle in months to see if they need assistance.
Fantastic - and welcome to @josuex09 and Costa Rica. I love the suggestions @sstead gave - these would be very useful even for a new instance (like CAnada) trying to make the case for grants and other funding. (ie we could show what is happening in established instances and use that as a set of goals for Canada to work toward.) I also wonder (I know nothing of the tech side of things - so disrgegard if this is irrelevant or just plain stupid - could the dashboard have the option of drilling down to look at the trade in specific products - ie: how many organic bananas were traded on the platform last year? Or to products of specific types - ie: the value of organic produce traded. These could be in economic value (dollars or whatever) or in volume/quanity. In this era of big data, such information is valuable to multiple parties outside of OFN, so we should think about the more political/social/ethical issues associated too. For example - can a hub or instance sell this data to a marketing research firm? (This is not to your question I know - but my non-technical mind goes first to these kind of legal, political and ethical questions.)
@josuex09@dberrocal@jefgomez - is it safe to assume that nothing else is happening with this and I can close the conversation off? and/or do you have any code / branch anywhere that people might use if they wanted to pick this up later? Thanks!

 - could the dashboard have the option of drilling down to look at the trade in specific products - ie: how many organic bananas were traded on the platform last year? Or to products of specific types - ie: the value of organic produce traded. These could be in economic value (dollars or whatever) or in volume/quanity. In this era of big data, such information is valuable to multiple parties outside of OFN, so we should think about the more political/social/ethical issues associated too. For example - can a hub or instance sell this data to a marketing research firm? (This is not to your question I know - but my non-technical mind goes first to these kind of legal, political and ethical questions.)