When you are investigating a problem, it is often useful to be able to see what’s happening in the browser (even if it appears to be nothing)
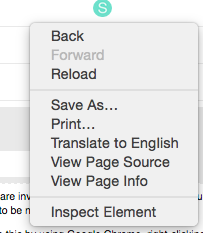
You can do this by using Google Chrome, right-clicking on your screen and selecting ‘inspect element’
This will open up an info bar at the bottom of your screen. NB. you often need to refresh the page once you’ve done this e.g. it won’t show you events that have already happened in a loaded page.
The two most useful tabs are:
- network - which tells you which page elements are taking how long to load
- console - will display error messages and tell you when things are going wrong with the page. You can often then take screen grab of these and attach in your bug reports. This info can help the developer work out what’s actually happening

