Last week I was tasked to find out whether the Orders & Fulfillments report improved its performance with the latest changes. It was probably too late for my brain, I got carried away and ended up checking the impact of all our peformance related changes in 2019 outlined in Global Gathering 2019 - Day 2 - Performance action plan  . There we were aiming for 3-5s to load pages.
I found interesting insights that are worth sharing with you all. This is just an evaluation of the status of performance. By no means, I pretend to decide what our priorities should be. Just pointing out facts to fuel future discussions.
I set up a dashboard for the occasion with graphs of what I explain below and I saved some queries as well. Feel free to check them out (if you have a Datadog account).
Public pages
Although there is a tangible improvement from the crazy situation we reached last summer. While with /map and /groups we reached our goals, /shops and /producers are much worse.
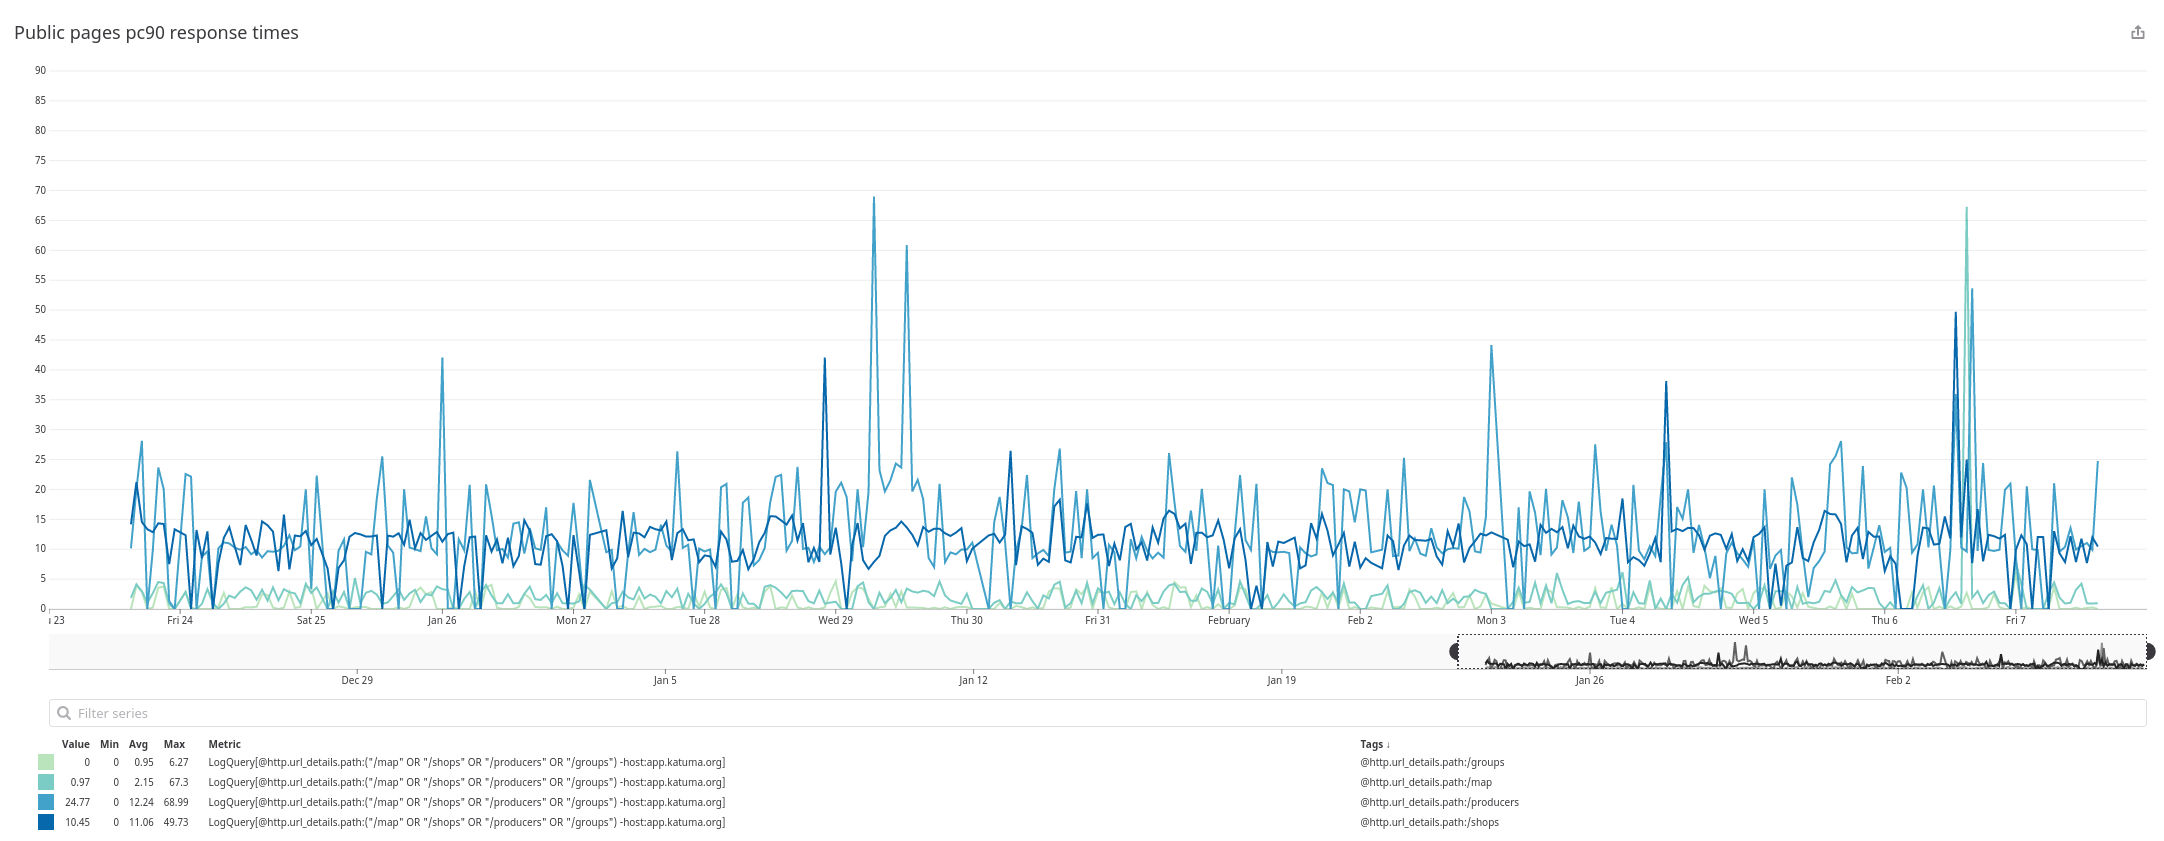
Most of the UK’s userbase experiences response times around 11s-14s for /shops and very occasionally things skyrocket exceeding the 25s.
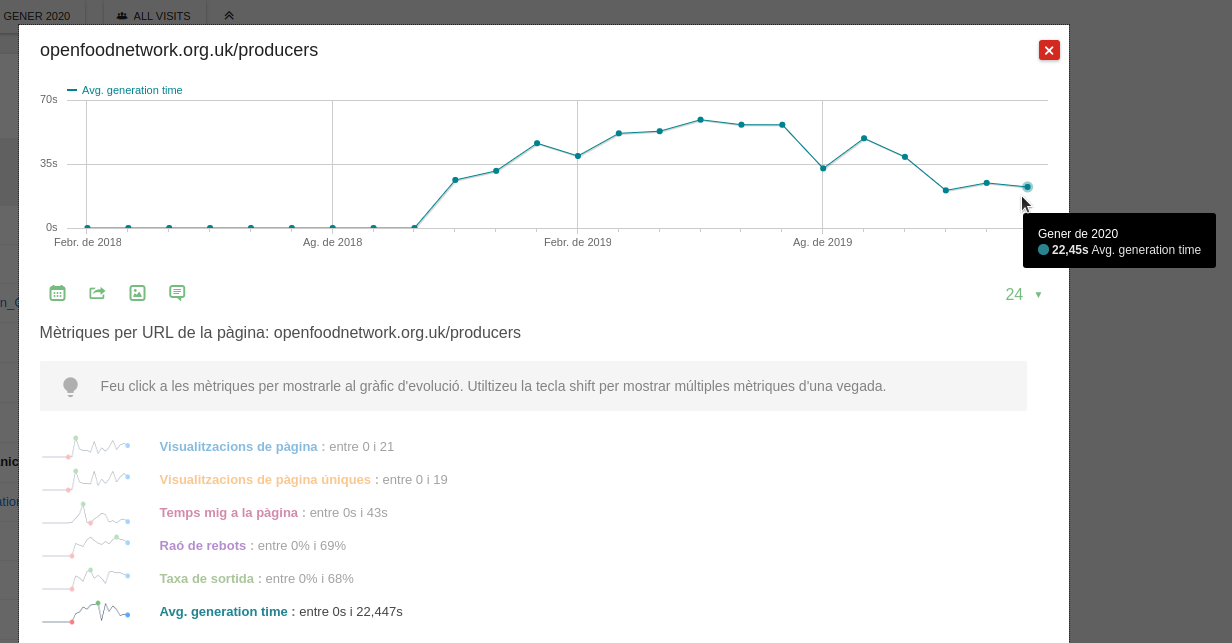
The situation is much worse for /producers where almost no one gets the page in less than 20s in the UK, with sporadic outliers that reach 45s.
This must be impacting conversions in some way and it is worth tracking from Matomo IMO. Fortunately, @Rachel already started working on this.
All this makes sense and clearly shows why pagination was a good decision. Paginated resources are predictable, not paginated ones aren’t.
Reports
We did a very job in reports too, considering that reports are always naturally a bit slow as they involve processing chunks of data, but there’s no surprise here. It is not rare for users to get Orders & fulfillment and Orders & distributors after 1min and sometimes 2.
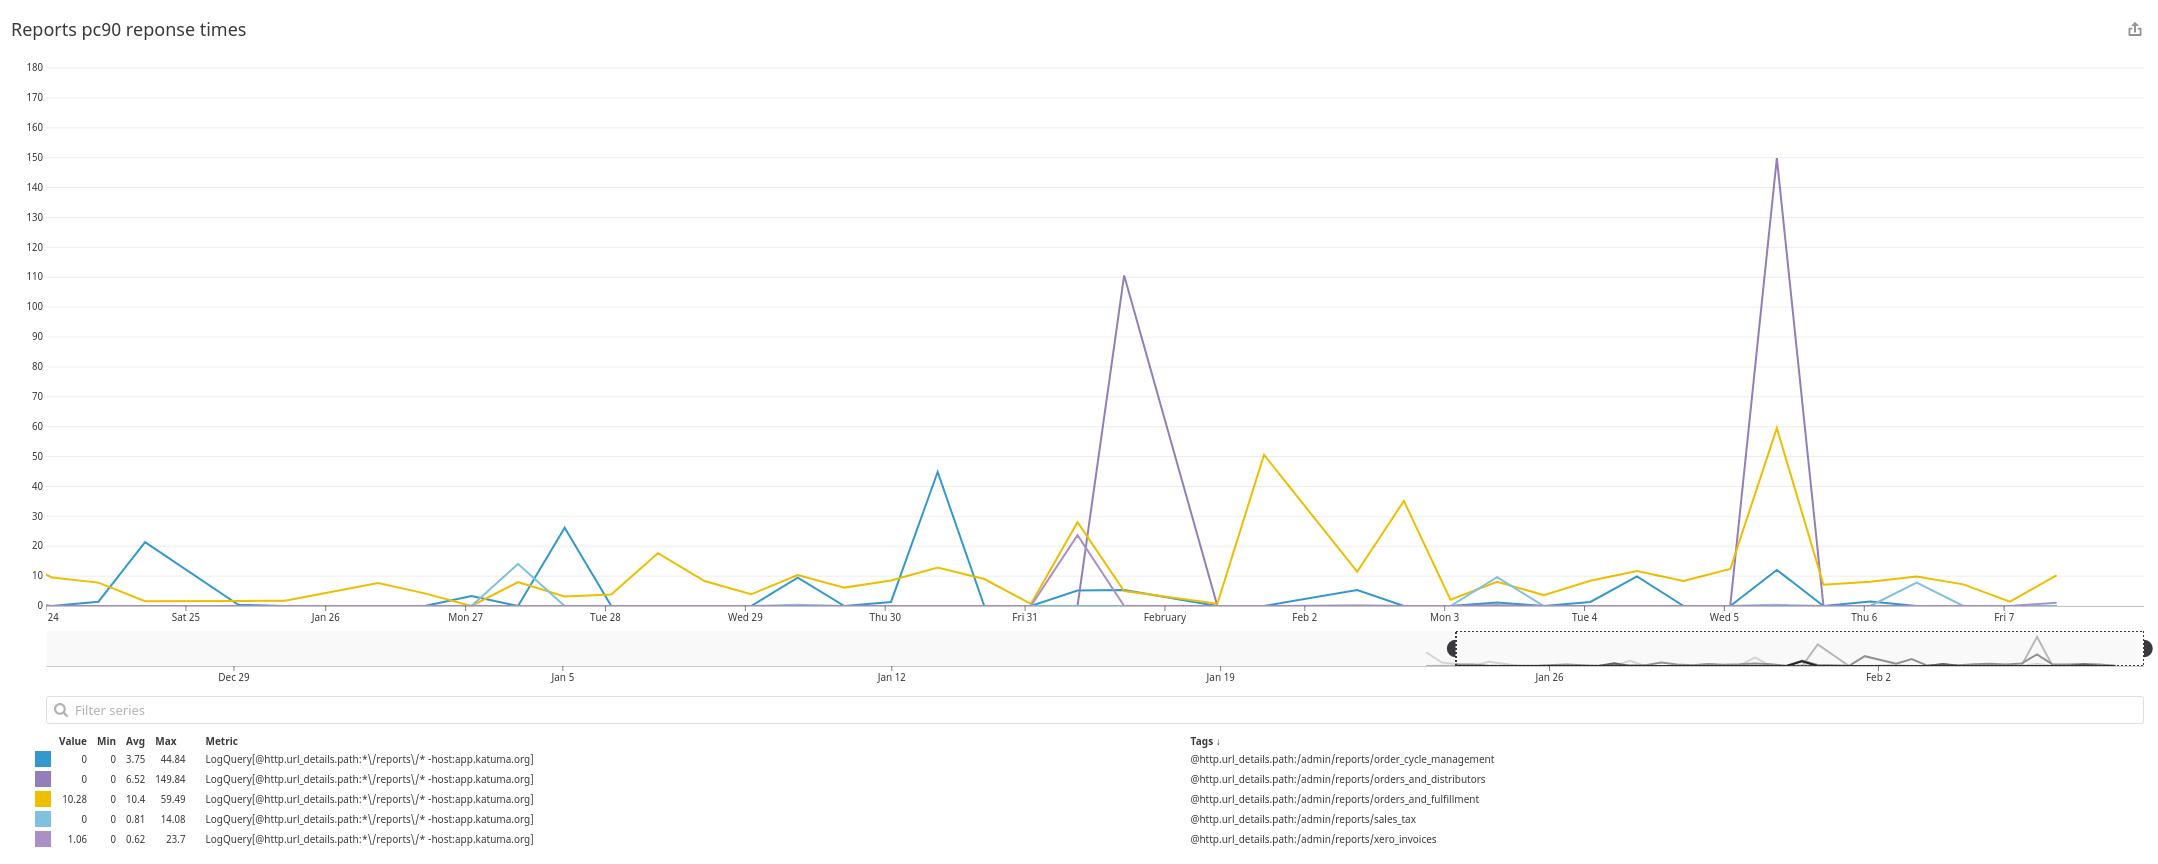
Good news about the infamous Orders & fulfillments though. 75% of UK users get their report in 10s or less!  More details in issue #4131.
Checkout
The checkout page performs reasonably well, most of the time people get it in 6s or less but there are still outliers every week up to 14s.
The process of placing the order, the checkout confirmation, performs a little worse than the checkout page rendering, but it’s slightly more predictable as its outliers rarely reach the 11s.
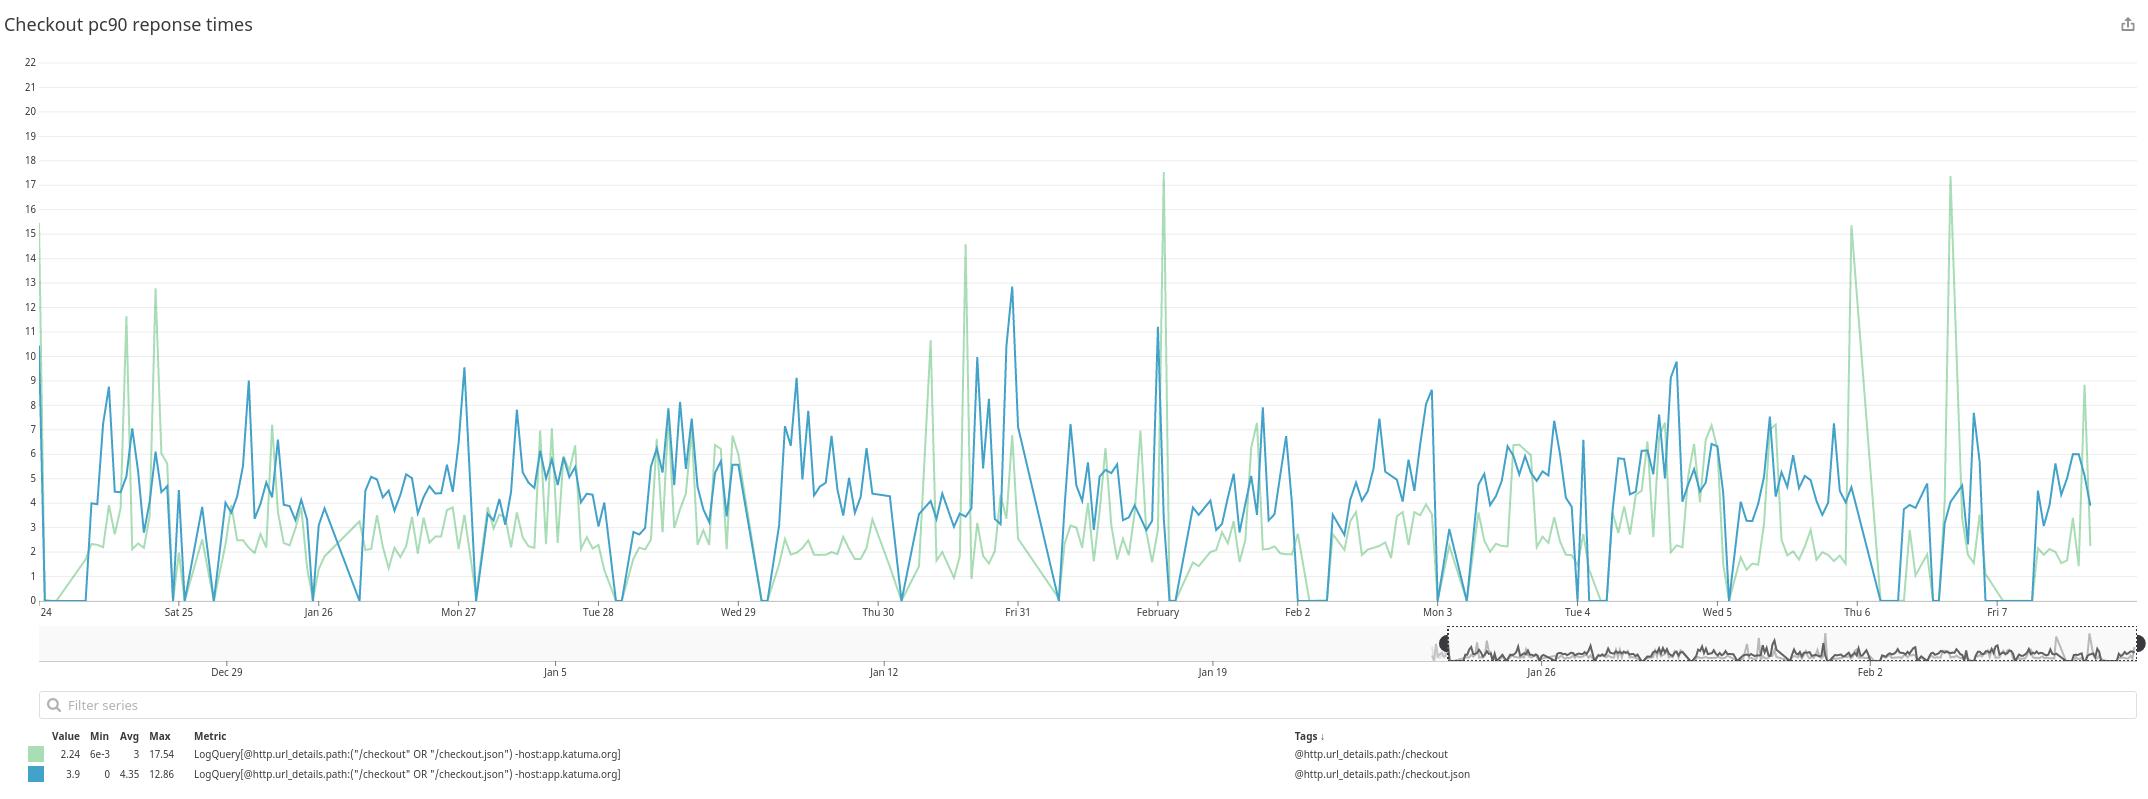
These spikes are somewhat critical for a marketplace if you ask me.
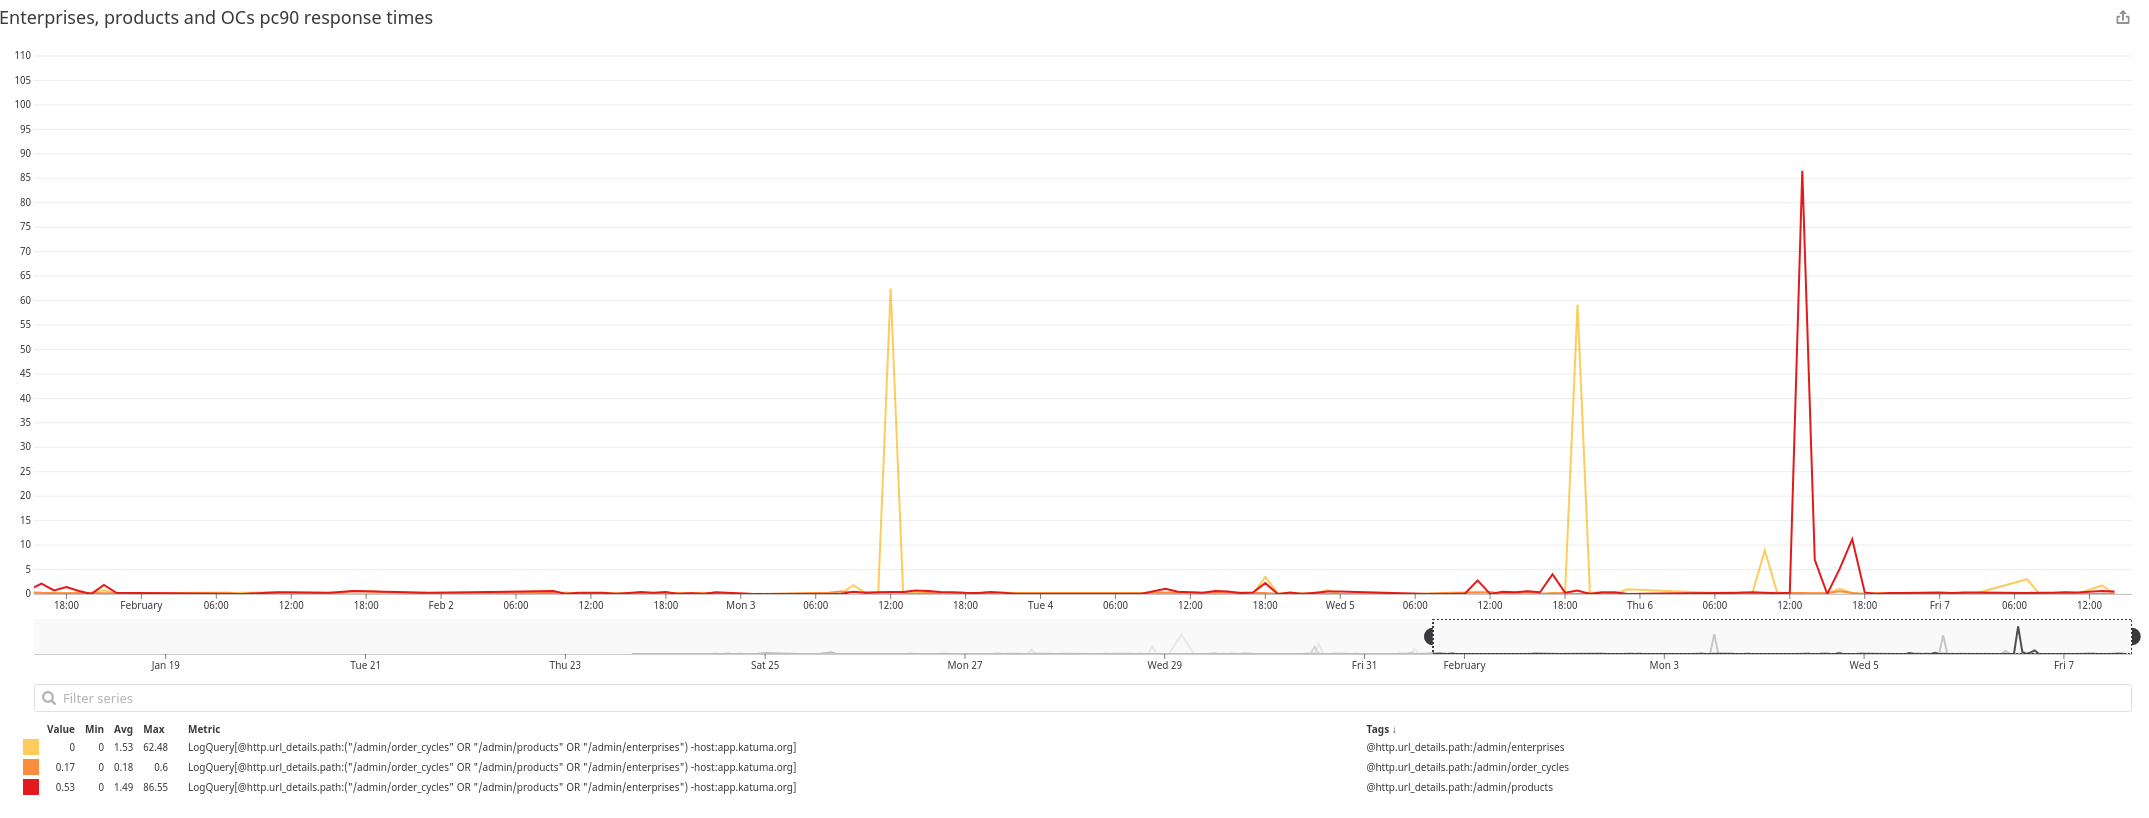
Admin: enterprises, products and OCs
Managers must be having a good experience listing enterprises, products and order cycles from /admin. 90% of their request are answered in 2s or less! but there are totally nuts outliers that are for sure related to superadmin usage.
I haven’t dug much deeper on product creation and update operations sorry. As for the new order cycle flow, I didn’t either but I can investigate that if you think is worth. Could use your help on that @luisramos0 .
What I did found out is that OC cloning is exceptionally slow sometimes (I haven’t checked how often that happens but I could) and it is a very common thing to do in OFN, I think. Might be worth tracking it to see its impact on business metrics.

Please ask
And my report ends here. I want to keep things short. Please, share your ideas and let me know if there is something that needs to be clarified or you want me to dig deeper. Don’t hestitate to question my conclusions either. I could be wrong.