Hi all, Lynne has asked me to investigate how we can incorporate the new product map with our CRM software, VTiger. The good news is it’s actually quite simple.
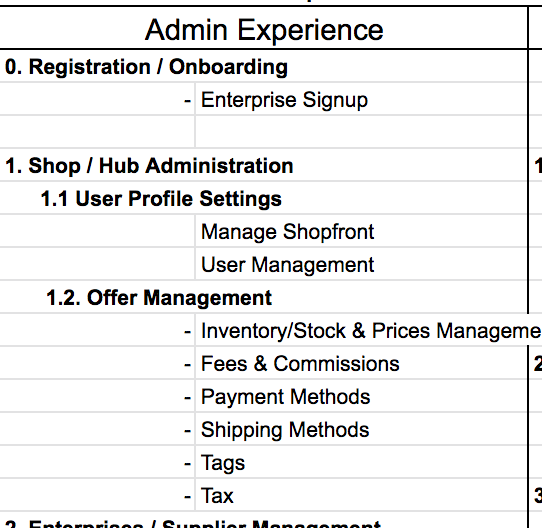
Even with the most basic VTiger package (which we use in the UK) there is a picklist called Category within the Cases module. I have added the following product map tag to this picklist:
All our support requests are automatically turned into Cases when they arrive in VTiger. So it is simply a job for the support team to assign cases to the most relevant category / product tag as they come in.
I have set up a report in VTiger which shows how many times that product tag / category was assigned to a Case each month so we can start to see which product tags are causing our enterprises and shoppers the most problems. I would be happy to make a little video or explainer to show exactly how I’ve done this in Vtiger if that would be helpful to anyone?
An important next step is to create a very clear description of what each Category refers to within the product. This will help all support teams to be clear about what kinds of issues map to which categories so that we can be more confident that the numbers accurately reflect the areas of the product we intend them to.
I have set up a report in VTiger which shows how many times that product tag / category was assigned to a Case each month so we can start to see which product tags are causing our enterprises and shoppers the most problems.
This will be very useful to help quantify the problems our users face with different product areas, a challenge that we currently face in the product vision process.
Could you share these reports, maybe in #analytics channel?
An important next step is to create a very clear description of what each Category refers to within the product.
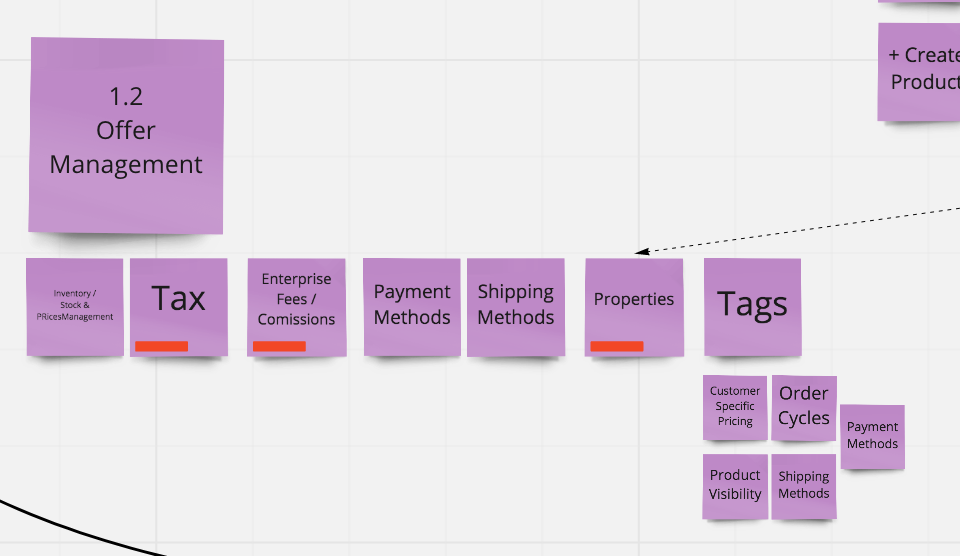
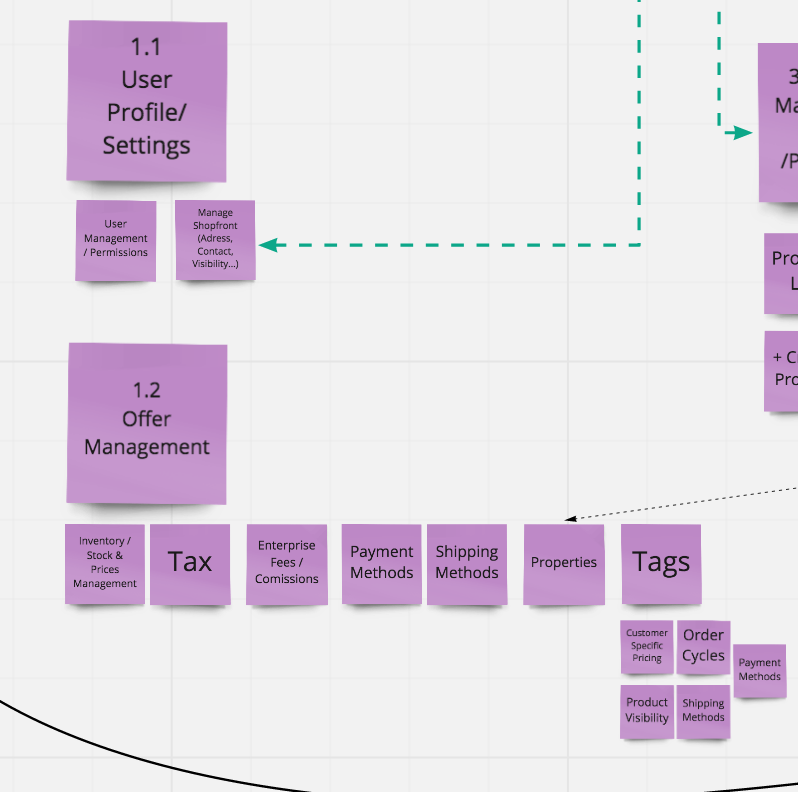
For this the more detailed version of the product map on the Miro Board should give guidance, as it specifies the sub “categories”, almost on a feature level, like here for 1.2. Offer Management:
Yes You can use the same labels to categorise your issues and report back monthly on how many issues arose from each category. Then we can compile your numbers too.
Sharing the process you use to categorise your issues might be useful for others.
I wonder if anyone would like to talk more about getting this data for each instance? Personally I think it would be awesome, but very much needs to be done in collaboration with support teams.
@lin_d_hop@Jo_daSilva If I understood it right you are counting 1 case = 1 request. Is it also 1 case = 1 request = 1 user. Or if users ask twice we count 2 ?
How do you handle the fact that in some emails, users will talk about several problems: do you create one case per issue? (I know we should, but in FR we are super lazy sometimes ).
Looking at your doc for March, you had 30 cases on orders. Am I right to say that those are 30 cases, but that you might have had a lot of email exchanges within these cases?
I want to make sure we will count the same way
Also @Jana looking back at the mapping I think we’ve forgotten “tags” in A6 customer management?
@Rachel Cases in vtiger are assigned categories. So if a user has a 20-email back and forth exchange on a single case, this is counted as 1. If a user opens a case, then we close/resolve the case, then a week later they ask again on a separate email thread that creates a separate case then that is counted additionally.
If a user asks 30 questions in a single email then it will be counted once with the most appropriate category.
The only thing we do is assign a category to each case. This is easy enough to do as requests come in. We’re not fussed on absolute accuracy so much as a general idea of where the problem is.
Interesting how different the support requests are between these first two months.
For example Shopfront complaints account for 20% of the Feb requests and then drop to 0, Order Management accounts for 8% in Feb and jumps to 30% of all cases in Marh.
(I added % and conditional formatting to highlight to the sheet).
Curious to see how this goes over time and for other instances
In case anyone is interested, I’ve just added UK support request data for April and May.
Order Management is emerging as the standout problematic area for support in our instance.
Also just to add that I love having these numbers. One day I even hope to see them change and reduce as we make improvements. Oh that will be joyful
If any other instances fancy playing you can add your info here. Or give me a shout if you’d like to understand better.
FR’s figures added for March, April and May. We have 6 to 8 times less support requests… Either there is a different way to count, either the UK support team is supporting an avalanche of requests. I think I will never complain again when doing support for FR … ping @Cecilia-Hn
Indeed. Just added the % to put things in relation.
March to May 30%-50% of all requests are on order management.
Would it make sense to go one detail level below for this case to understand which subarea of order management is causing the problems (like search, payment + refunds, subscriptions…)?

 You can use the same labels to categorise your issues and report back monthly on how many issues arose from each category. Then we can compile your numbers too.
 ).
).
 … ping
